Dashboard Overview
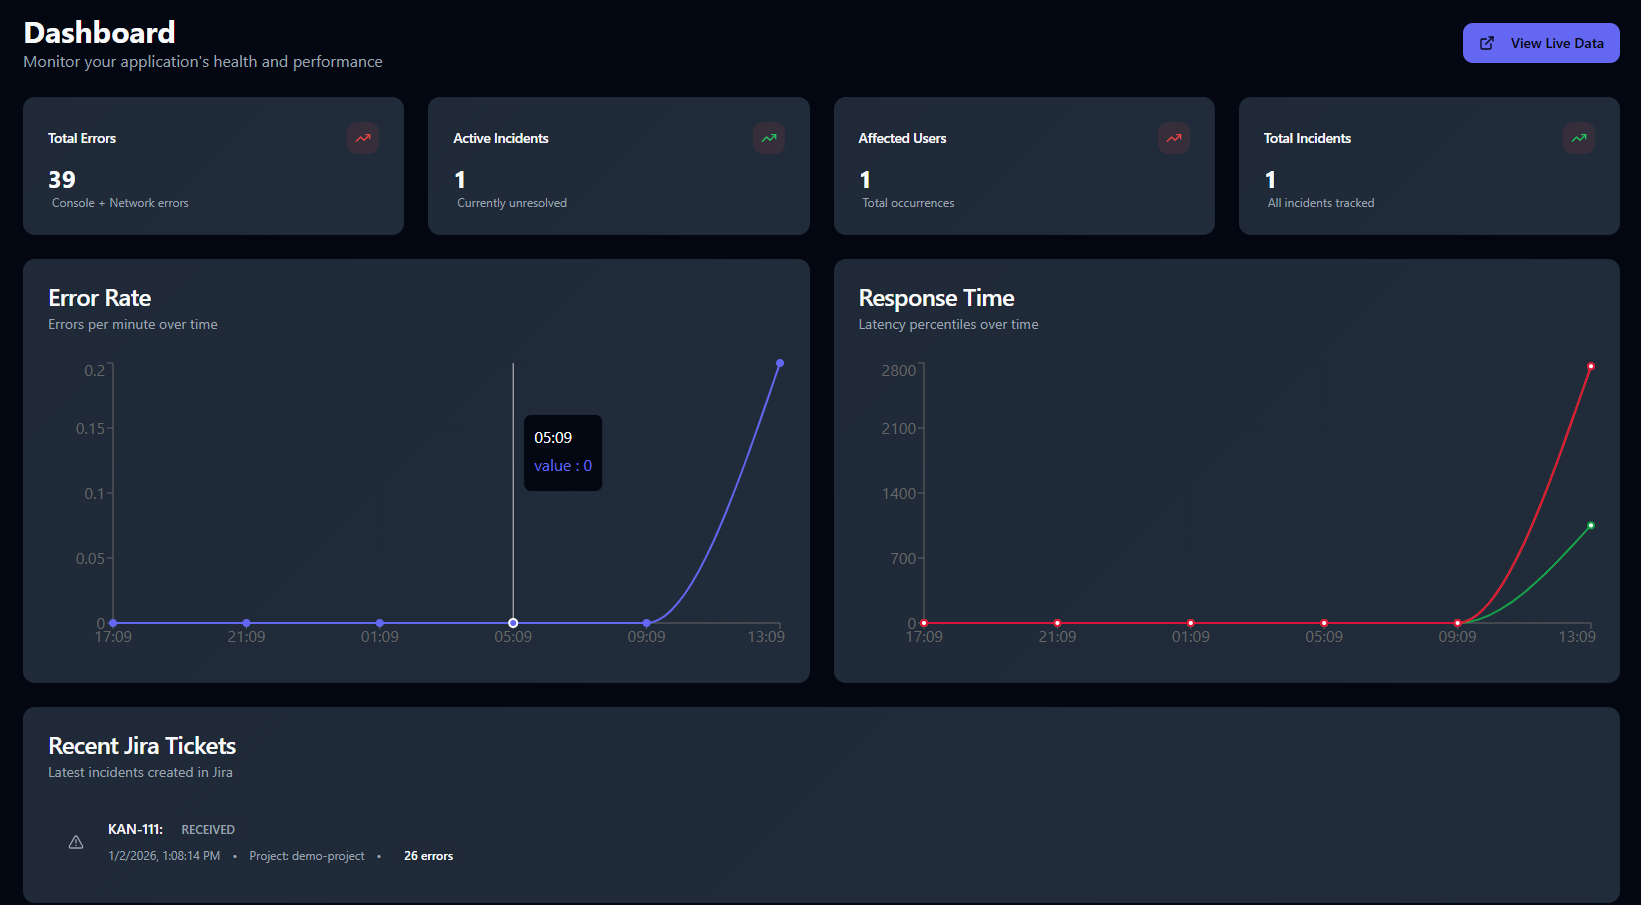
The Ampliserv Dashboard provides a comprehensive view of your application's health, performance metrics, and incident management status in real-time.
Accessing the Dashboard
- Login to Ampliserv at
https://dev-app.ampliserv.io - Navigate to Dashboard from the main navigation menu
- View real-time metrics and performance data
Dashboard Components
1. Metrics Summary Cards
Four key metrics are displayed at the top:
| Metric | Description | Trend Indicator |
|---|---|---|
| Total Errors | Console + Network errors detected | 🔴 Red (increase) / 🟢 Green (decrease) |
| Active Incidents | Currently unresolved incidents | 🔴 Red (increase) |
| Affected Users | Total occurrences across users | 🔴 Red (increase) |
| Total Incidents | All incidents tracked historically | 🔴 Red (increase) |
2. Error Rate Chart
Location: Left chart in the middle section
Features:
- Real-time tracking of errors per minute
- Time range: Last 24 hours (default)
- Interactive tooltip: Hover for exact values
- Zoom capability: Click and drag to zoom
Usage:
- Monitor error spikes after deployments
- Identify recurring error patterns
- Track resolution effectiveness
3. Response Time Chart
Location: Right chart in the middle section
Features:
- Latency percentiles: P50, P95, P99
- Color-coded lines:
- 🟢 P50: Green (median response time)
- 🟡 P95: Yellow (95th percentile)
- 🔴 P99: Red (99th percentile)
- Time synchronization with error chart
Usage:
- Detect performance degradation
- Identify slow endpoints
- Monitor infrastructure health
4. Recent Jira Tickets
Location: Bottom section
Features:
- Latest incidents synchronized with Jira
- Status badges: Color-coded by severity
- Quick access: Click to view details
- Real-time updates: Auto-refreshes every 30 seconds
Columns:
- Jira Ticket: Ticket key with external link
- Status: Current Jira status
- Priority: Incident priority level
- Created: Timestamp
- Project: Jira project key
Real-time Features
Auto-refresh
- Metrics: Update every 30 seconds
- Charts: Real-time data streaming
- Incidents: Live sync with backend