Session Replay Analysis
Session Replay allows you to view and analyze user sessions recorded by the Ampliserv Frontend SDK. Watch exactly what users experienced during incidents to understand issues from their perspective.
Overview
Session Replay captures:
- User interactions: Clicks, typing, scrolling
- Network requests: API calls and responses
- Console logs: JavaScript errors and warnings
- Performance data: Render times and metrics
- Visual playback: Exact screen reproduction
Accessing Session Replays
- Login to Ampliserv dashboard
- Navigate to "Sessions" from the main menu
- View available session replays
- Click "Play" to watch any session
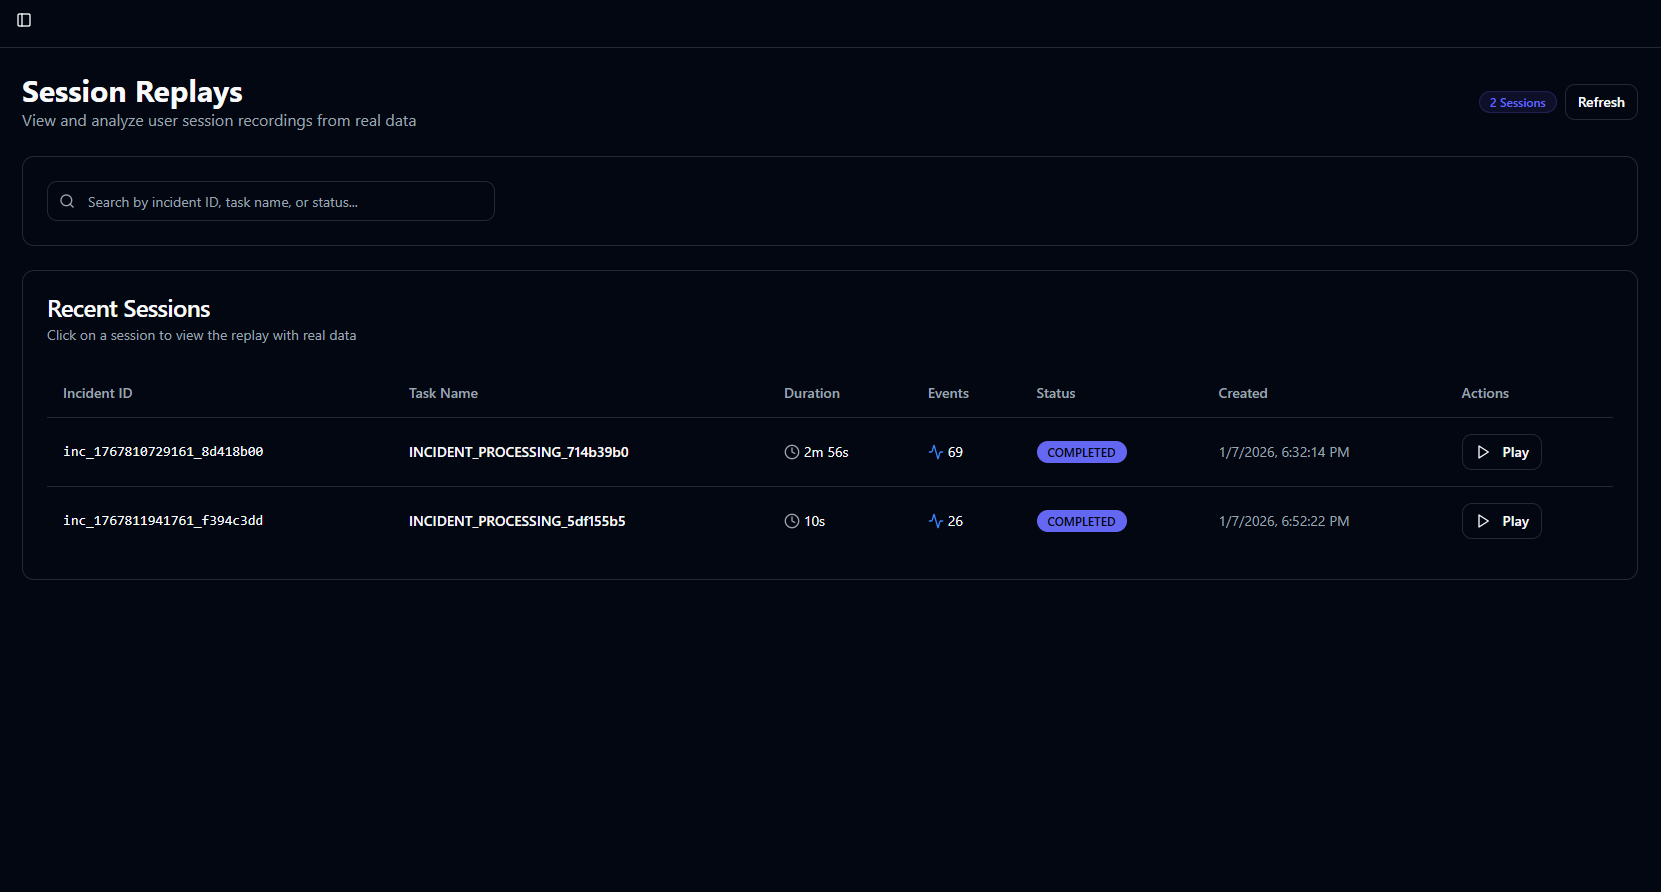
Page Layout
1. Header Section
- Session count: Total available replays
- Refresh button: Manual data refresh
- Status indicators: Recording/Processing/Completed
2. Search Functionality
- Search bar: Find by incident ID or task name
- Real-time filtering: Results update as you type
- Multi-field search: Searches across all columns
3. Sessions Table
Interactive table with session details:
| Column | Description | Features |
|---|---|---|
| Incident ID | Linked incident identifier | Clickable link |
| Task Name | Session recording context | Descriptive name |
| Duration | Session length in mm:ss | Clock icon |
| Events | Number of captured events | Activity icon |
| Status | Replay processing status | Color-coded badge |
| Created | Recording timestamp | Formatted date |
| Actions | Play/Download buttons | Interactive |
Session Statuses
Processing States
| Status | Badge Color | Description |
|---|---|---|
| RECORDING | 🔵 Blue | Actively capturing session |
| PROCESSING | 🟡 Yellow | Preparing for playback |
| COMPLETED | 🟢 Green | Ready to view |
| FAILED | 🔴 Red | Error during processing |
| ARCHIVED | ⚪ Gray | Moved to cold storage |
Quality Indicators
- High Quality: Full DOM recording
- Medium Quality: Screenshot-based
- Low Quality: Limited interaction data
- Degraded: Network issues during capture
Playing Session Replays
Replay Player Interface
When you click "Play", you'll see:
1. Player Controls
- Play/Pause: Spacebar or click
- Timeline scrubber: Drag to navigate
- Speed control: 0.5x to 4x speed
- Volume control: Mute/Unmute audio
2. Session Information Panel
- User details: Browser, OS, device
- Network conditions: Connection type, speed
- Geographic data: Location, timezone
- Custom metadata: User ID, session tags
3. Event Timeline
- Vertical timeline: Chronological events
- Event types: Clicks, errors, network calls
- Jump to event: Click to navigate
- Event details: Expand for full data
Player Features
Interactive Playback
- Click tracking: See where users clicked
- Input replay: Watch form filling
- Scroll playback: View page navigation
- Error highlighting: Visual error indicators
Debug Tools
- DOM Inspector: View page structure
- Console Replay: Watch JS errors occur
- Network Monitor: See API calls
- Performance Metrics: FPS, memory usage
Collaboration Features
- Share session: Generate shareable link
- Add comments: Time-stamped notes
- Export frames: Save specific moments
- Compare sessions: Side-by-side view